Next article: Late Night Cocoa: NSOperationQueue Problems
Previous article: Friday Q&A 2009-01-30: Code Injection
Tags: fridayqna performance shark
Welcome back to Friday Q&A.; This week I'm taking Jeff Johnson's idea to discuss optimization and profiling tools.
Tools
So you've progressed beyond the first rule of optimization (Don't Do It) and have decided that enough time has passed at the second rule (Don't do It Yet). Being smart about this whole optimization business, you know that the first thing you need to do before you actually start changing code is to measure it.
Measurement breaks down into two basic categories:
- Overall performance. This is usually defined in terms of operations per second, whatever it is that you're doing. If it's an animation, this will probably be frames per second. If it's some kind of lookup system, it might be searches per second. More exotic cases might look at CPU usage or memory consumption. No matter what it is, you need to come up with a number so that you can do before-and-after comparisons to see how much any given code change helped (or hurt).
- Profiling. This tells you how much time the computer spent in every piece of your code. You need this so that you know which parts of the code to attack.
You may be tempted to use Instruments. It is new and shiny and Apple hypes it up a lot. Don't. When it comes to profiling, Instruments, in a word, blows. It's difficult to use, bloated, and doesn't provide enough information. As if that weren't bad enough, in threaded applications it frequently provides information which is just plain wrong. Avoid Instruments for this work.
(Actually it's pretty good at other kinds of profiling, like memory usage. But when it comes to reducing CPU usage, Instruments is worse than useless.)
There are other tools on the system, such as Activity Monitor's sample command, or the 'sample' command line tool (which Activity Monitor uses) but there's really only one worthy tool for this job: Shark.
Opinions may differ, but mine is solid: Shark is the only tool to even consider using here. Some of the others are decent (aside from Instruments), but Shark is pure gold. I have actually had people who have never touched a Mac before tell me that they need to buy one after I give them a 30-second demo of this program. It's that good.
Something to Optimize
Before we can talk about Shark, we need a program to use it on. I wrote a little program that just searches for substrings in the /usr/share/dict/words word list that ships with the operating system. Here it is:
    #import <Foundation/Foundation.h>


    @interface Dict : NSObject
    {
        NSArray *_words;
    }
    - (NSArray *)find:(NSString *)toFind;
    @end

    @implementation Dict
    - (id)init
    {
        if((self = [super init]))
        {
            NSString *str = [NSString stringWithContentsOfFile:@"/usr/share/dict/words"];
            _words = [[str componentsSeparatedByString:@"\n"] copy];
        }
        return self;
    }

    - (void)dealloc
    {
        [_words release];
        [super dealloc];
    }

    - (NSArray *)find:(NSString *)toFind
    {
        NSMutableArray *array = [NSMutableArray array];
        for(NSString *word in _words)
        {
            if([[word lowercaseString] rangeOfString:[toFind lowercaseString]].location != NSNotFound)
                [array addObject:word];
        }
        return array;
    }
    @end

    int main(int argc, char **argv)
    {
        NSAutoreleasePool *outerPool = [[NSAutoreleasePool alloc] init];

        NSTimeInterval start = [NSDate timeIntervalSinceReferenceDate];
        NSTimeInterval lastPrinted = start;
        unsigned counter = 0;
        while(1)
        {
            NSAutoreleasePool *innerPool = [[NSAutoreleasePool alloc] init];
            Dict *dict = [[Dict alloc] init];
            [dict find:@"bob"];
            [dict release];
            counter++;

            NSTimeInterval now = [NSDate timeIntervalSinceReferenceDate];
            if(now - lastPrinted >= 1.0)
            {
                NSLog(@"%.1f/sec", counter / (now - start));
                lastPrinted = now;
            }
            [innerPool release];
        }

        [outerPool release];
        return 0;
    }
There are a lot of pretty obvious speed problems here, but it's meant to illustrate the usage of Shark, not be a perfect real-world example.
First, let's establish a baseline by running the program. You'll notice that I measure the number of lookups performed per second and print it out periodically. This is the overall performance number that we'll be concentrating on. On my Mac Pro, I see about 1.6/sec with this code.
Let's shark it:

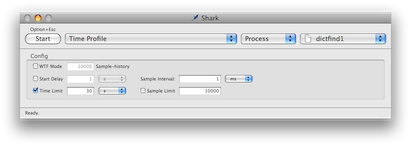
This is the opening window, where you control what Shark will do. For now we'll set it to Time Profile, Process, and give it our dictfind1 program, which we've already run in a shell. The other settings can be left alone. Then we click the Start button, wait 30 seconds, wait some more for it to process, and we can view the results:

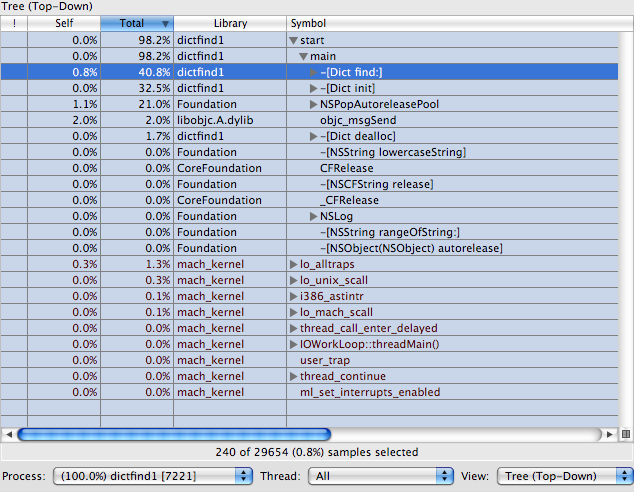
I have it in Tree (Top-Down) mode which is generally the best mode to use for profiling. This shows you the call stacks that were profiled from the top down. Here you can see that start called main which then called -[Dict find:], -[Dict init], and a bunch of others.
The Self and Total columns are important here. the Self column shows how much CPU time was spent in that function. The Total column shows how much time was spent in that function and in all of its descendants. We can see here that -[Dict find:] is responsible for 40.8% of all CPU time. However we can see that only 0.8% of the time is spent in -[Dict find:] itself. The other 40% of the time is spent in things being called from there. This tells us that we may be able to optimize that method by changing what it calls, but we won't gain much by trying to make the code right in -[Dict find:] go faster.
There's one obvious bit of slowness here, which was probably obvious just from looking at the code and is even more clear once we have the profile to look at: this code reinitializes the dictionary every time through the loop! If we imagine that our real case is going to be looking up a lot of words for each run, this is foolish. Let's create a single instance of Dict before the loop and just reuse it for each pass. You'll find this modified code in dictfind2.m in the package.
Compile and run. Result: 2.7/sec. Not bad! That's about a 70% speedup over the original code, just from moving two lines of code around.
Of course this is still pretty slow, so let's see what else we can do. Profiling this version, we see that about 70% of the time is spent in -[Dict find:] and about 26% in NSPopAutoreleasePool. The latter is an indication that we're creating too many temporary objects. If we pop open -[Dict find:] we can immediately see why: half the time is spent calling -[NSString lowercaseString], and that of course produces a temporary object each time which then needs to be destroyed. So we can guess that about 75% of this program's time is due to the two calls to that method.
Easy fix, though: NSString allows case insensitive searching. Instead of comparing lowercase strings, we'll just compare the original strings with the case insensitive option set. dictfind3 in the package contains this change.
Compile and run. Result: 17.5/sec. This is a 6.5x speedup over dictfind2, roughly in line with what we would expect. (Removing code that takes up 75% of the time should result in a 4x speedup, and the numbers are imprecise enough that this is well within the fudge factor.) It's an 11x speedup over the original code. Not too bad at all.
But still, under 20 lookups per second kind of sucks. Let's profile this version too. What we find is that 90% of the time is spent in -[NSString rangeOFString:options:]. We don't control that code, and it's hard to imagine that we could write a faster custom version. Optimizing the rest of the code will win us at best 10%. So now we're stuck.
If we can't speed up -[NSString rangeOFString:options:], maybe we can call it less frequently. Let's start to think of an algorithmic improvement. Every time we do a search, we do a linear search through the entire dictionary. Can we reduce that?
It's tricky, because we're doing a substring search, so something easy like sticking everything in an NSDictionary won't do. Neither will a classic binary search. A modified binary search will do it, if we pay a memory price. Instead of storing each word in the array to search, we'll store pairs. The first part of a pair will be a suffix of the word, and the second part will be the entire word. Then if we binary search on the suffixes, we can rapidly find all words which contain the search term. The memory cost will be substantial: a 10-character word will result in 10 entries in the array instead of just 1, and with all those suffix strings floating around in memory. But if we really want speed, the tradeoff may be worth it.
dictfind4 contains the binary search version. Dictionary initialization is now substantially more complex, building up all the substrings. In the find routine, we take advantage of CoreFoundation toll-free bridging and use the CFArrayBSearchValues function.
Compile and run. Result: initialization takes forever, over 10 seconds on my computer. But once that's done, the reward is enormous, at about 24500/sec. This is a 1400x speedup over the last version, and a 15000x speedup over the original.
Let's profile this one too just for fun. We find that 22.5% of the time is spent just in -[NSCFArray addObject:]. This code spends nearly a quarter of its time just adding the results to the array after it finds them! There are no doubt further optimizations to be had here, but at this point we hit diminishing returns. We already got a fifteen-thousand-times speedup over the original slow version, and that's good enough for me.
Before we quit for the day, let's flip Shark into "Heavy (Bottom-Up)" mode:

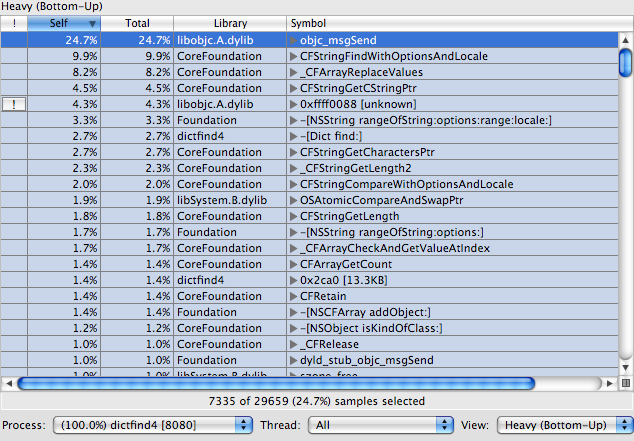
This essentially flips everything around. Instead of showing the top of each stack, and then showing what each entry called underneath, it shows you the bottom first. It then shows what functions called it, what functions called those functions, and so forth. This is generally less useful than the top-down mode, but sometimes it's really handy, because occasionally you have an important bottleneck which is called from many locations scattered around your code.
This is a great illustration of just one of those cases. We see that objc_msgSend is taking up 25% of our time now. Of course we can't very well improve on libobjc, but if we were after even more speed we might start taking measures to make fewer message sends.
Wrapping Up
Hopefully this should get you started on Shark, but I've barely scratched the surface of what it can do. If you double-click any entry in the profile list, Shark will show you the source of the function in question. (The actual source if available, assembly if not.) In that view it will give you a line-by-line listing of exactly where your time is being spent. Even crazier, Shark has a big database of common speed problems and sometimes will actually give you advice on what's slow and how to fix it. (Look for the little exclamation point, and click on it to get the advice.) And there's so much more beyond this. This is a truly wonderful tool that Apple has produced. (Those who know me well are gasping in surprise at this remark, but it's true!)
That's in for this week. Have a great optimization battle story? Think my slam of Instruments was totally unfair? Comment below. Come back next week for another exciting edition.
And as always, Friday Q&A; is powered by the donation of your ideas. If you have a topic that you would like to see discussed here, leave it in the comments or e-mail it, and tell me if you don't want me to use your name.
Comments:
Comments RSS feed for this page
Add your thoughts, post a comment:
Spam and off-topic posts will be deleted without notice. Culprits may be publicly humiliated at my sole discretion.